
EARLY WEATHER FORECASTING & PREDICTIONS
The discipline of weather forecasting dates back several centuries, with early civilizations having used meteorological and astronomical events to help monitor seasonal changes in weather conditions.
The first known civilization that tried to predict weather changes was the Babylonians around 650 B.C. They relied on cloud appearance and optical phenomena such as haloes in their attempts to predict short term weather changes.
Around 340 B.C. the Greek philosopher Aristotle wrote a philosophical treatise called Meteorologica. The theories included were the formation of rain, clouds, hail, wind, thunder, lightning, and hurricanes. Even though many of his theories were incorrect, his four-volume text was considered by many to be the leading weather authority for almost 2,000 years.

Throughout the centuries, attempts have been made to predict forecasts based on weather folklore and personal observations. In East Tennessee, the arrival of fall colors taking over is a sure sign that winter is just around the corner. Other signs, however, may not be as reliable.
Have you heard about wooly worms? According to folklore, the wider or more “rusty” or brown the segments, the milder the winter. The wider or more blacker the segments, the more intense the winter was predicted to be.

Courtesy of NOAA Library Collection
However, it became increasingly evident that the speculations of natural folklore were inadequate and that greater knowledge was necessary for further understanding of the atmosphere.
In order to gain a greater understanding of the weather, instruments were needed to measure the different properties of the atmosphere, such as temperature, relative humidity, precipitation, and pressure.

The first known design in western civilization for the hygrometer, an instrument used to measure the humidity of the air, was described by Nicholas Cusa (c.1401-1464, German) in the mid-fifteenth century. Galileo Galilei (1564-1642, Italian) invented an early thermometer in 1592 or shortly thereafter; and Evangelista Torricelli (1608-1647, Italian) invented the barometer for measuring atmospheric pressure in 1643.
While these meteorological instruments were being refined during the seventeenth through nineteenth centuries, other related observational, theoretical, and technological developments also contributed to our knowledge of the atmosphere. In order to maximize agricultural yield, it was necessary to take accurate weather records to better understand the climate of an area. The first continuous weather records in the U.S. were kept in 1644 and 1645 by the Reverend John Campanius Holm near Wilmington, Delaware.
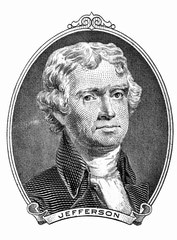
Thomas Jefferson purchased a thermometer and barometer from a local patron while in Philadelphia for the adoption of the Declaration of Independence. He noted that the high temperature in Philadelphia, Pennsylvania on July 4, 1776, was 76 degrees. Jefferson made regular observations at Monticello from 1772-78. George Washington also took regular weather observations; the last weather entry in his diary was made the day before he died.
The invention of the telegraph and the emergence of telegraph networks in the mid-nineteenth century allowed the routine transmission of weather observations to and from observers and compilers. When the telegraph became operational in 1845, visionaries saw the possibility of forecasting storms simply by telegraphing ahead what was in store.
Joseph Henry, Secretary of the new Smithsonian Institution, envisioned opportunities of the communicant system and suggested the following: “… a system of observation which shall extend as far as possible over the North American continent… The Citizens of the United States are now scattered over every part of the southern and western portions of North America, and the extended lines of the telegraph will furnish a ready means of warning the more northern and eastern observers to be on the watch from the first appearance of an advancing storm.”
By the end of 1849, 150 volunteers throughout the United States were regularly reporting weather observations to the Smithsonian regularly. Then by 1860, 500 stations were furnishing daily telegraphic weather reports to the Washington Evening Star. As the network grew, other existing systems were gradually absorbed, including several state weather services.
Using the observation data, weather maps were drawn and surface wind patterns and storm systems could be identified and studied. Weather-observing stations began appearing internationally in the 1860s. The United States government recognized the need to organize and maintain a nationalized weather service, thus the National Weather Service was created.
INTRODUCTION OF THE
NATIONAL WEATHER SERVICE
On February 9, 1870, a joint Congressional Resolution that required the Secretary of War “to provide for taking meteorological observations at the military stations in the interior of the continent and at other points in the States and Territories…and for giving notice on the northern (Great) Lakes and on the seacoast by magnetic telegraph and marine signals, of the approach and force of storms” was introduced and passed. President Ulysses S. Grant signed it into law thereby authorizing the Secretary of War to establish a national weather service within the U.S. Army Signal Service’s Division of Telegrams and Reports.
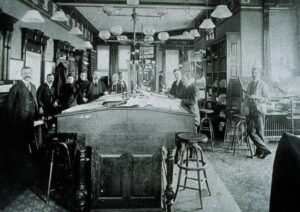
NOAA Library Collection. A Weather Bureau office – location and date unknown.
Within the Department of War, it was assigned to the Signal Service Corps under Brigadier General Albert J. Myer. General Myer gave the National Weather Service its first name: Division of Telegrams and Reports for the Benefit of Commerce.
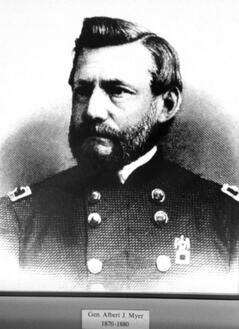
NOAA Library Collection. General Albert J. Myer, the first director of the National Weather Service.
Later that year, the first systematized, synchronous weather observations ever taken in the U.S. were made by “observing-sergeants” of the Army Signal Service at 22 stations and telegraphed to Washington.

NOAA Library Collection. Top of the U.S. Weather Bureau Building in Washington 1899 c. In: The Aims and Methods of Meteorological Work by Cleveland Abbe. In: Maryland Weather Service, Johns Hopkins Press, Baltimore, 1899. Volume I. Page 307. Archival photograph by Mr. Sean Linehan.
These observations were collected to produce nation-wide weather maps, which were used to record observations across the nation and help with producing daily forecasts. An agency was born, which would affect the daily lives of most of the citizens of the United States through its forecasts and warnings.
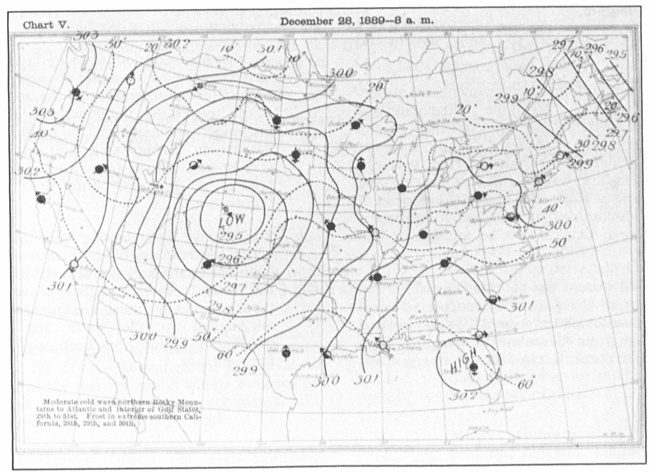 NOAA Library Collection. Weather maps produced by the Signal Service in 1889. Note the locations of the weather offices. The Knoxville weather office was one of the first 22 observation sites.
By the end of 1891, there were 541 stations in operation. While the Signal Service rapidly produced its meteorological work, there was considerable internal and external strife within the Signal Corps especially after the death of General Myer on August 24, 1880. The War Department did not strongly support meteorological activities, and at the same time Secretary of Agriculture wanted the weather responsibility. Accordingly, the weather service was transferred to the Department of Agriculture on October 1, 1890, effectively creating the United States Weather Bureau.
One of the most devastating weather events in the United States occurred in September 1900 when a hurricane struck Galveston, Texas, killing more than 6,000 people. The wife of the Galveston U.S. Weather Bureau Official-in-Charge, Isaac Cline, and one employee were killed in the associated flooding. To help gain a greater understanding of the weather in preparation for disasters such as these, the Weather Bureau began its program of free-rising balloon observations in 1909. Inflation of a pilot balloon was used to determine cloud heights, wind speed, and direction as the balloon ascended.

NOAA Library Collection. Inflating a pilot balloon in 1944. Women’s first opportunities in meteorology occurred as a result of WWII. More than 900 women were employed by the Weather Bureau as observers and forecasters, a result of filling positions typically reserved for men during World War II.
The Weather Bureau remained under the Department of Agriculture until 1940 when it was transferred to the Department of Commerce.
In 1952, the Weather Bureau organized the Severe Local Storms Forecasting Unit in Washington, D.C., and began issuing tornado forecasts for the nation. The first radar specifically designed for meteorological use, the AN/CPS-9, was unveiled by the Air Weather Service, United States Air Force, in 1954.

NOAA Library Collection. A non-tornadic spiral-shaped radar echo is apparent in the lower left quadrant of the scope image from Maxwell Air Force Base, Alabama, on July 1, 1959. Observed on AFB CPS-9 PPI scope. The spiral echo is about 90 miles southwest of radar location.
In 1957, the Weather Bureau’s first WSR-57 weather surveillance radar was commissioned at the Miami Hurricane Forecast Center. The WSR-57 radar was stationed across much of the nation in the 60s and 70s and was utilized by the Weather Bureau to help issue tornado, severe storm, and flash flood warnings across the nation.
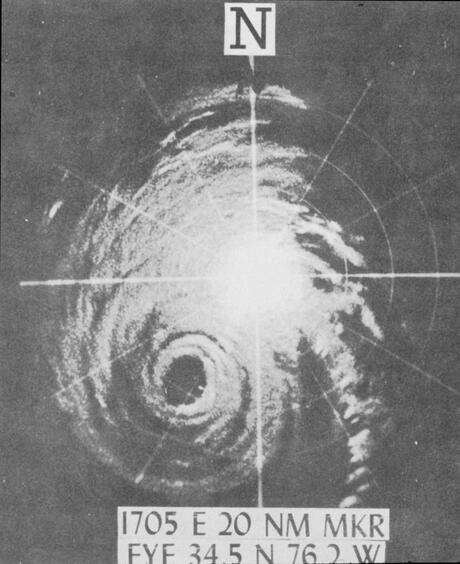
NOAA Library Collection. Hurricane Helene as observed by the Weather Bureau WSR-57 radar at Cape Hatteras, North Carolina, on September 27, 1958. At the time of observation, the storm was southwest of Cape Hatteras in the vicinity of Cape Fear.
In 1955, regularly-scheduled operational computer forecasts were begun by the Joint Numerical Forecast Unit (JNFU). The Weather Bureau became a pioneer civilian user of computers along with the Census Bureau in commerce, and the bureau began development of a Barotropic model, a first for numerical predictions.
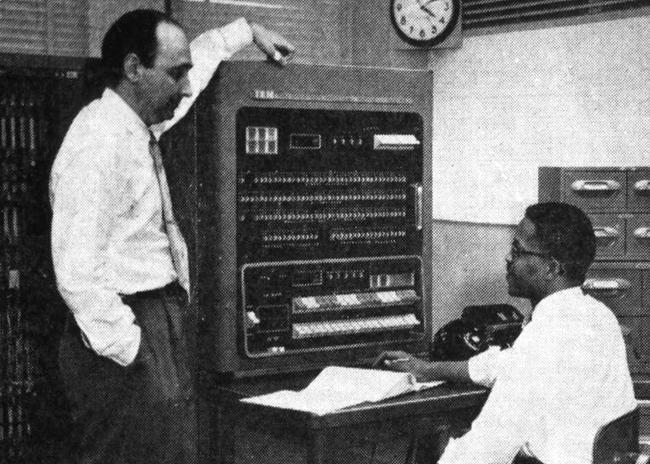
Fred Shuman (left) and Otha Fuller, circa 1955 at the IBM 701. The 701 was the first computer used by the JNFU to produce operational numerical weather predictions.
The world’s first weather satellite, the polar-orbiting TIROS I, successfully launched from the Air Force Missile Test Center at Cape Canaveral, Florida, on April 1, 1960. This was followed by the launch of TIROS II on November 11. The Weather Bureau and NASA invited scientists from 21 nations to participate in the analysis of weather data gathered by TIROS II. In 1963, the polar-orbiting weather satellite TIROS III was launched with automatic picture transmission capability, eventually providing continuous cloud images to over 100 nations.
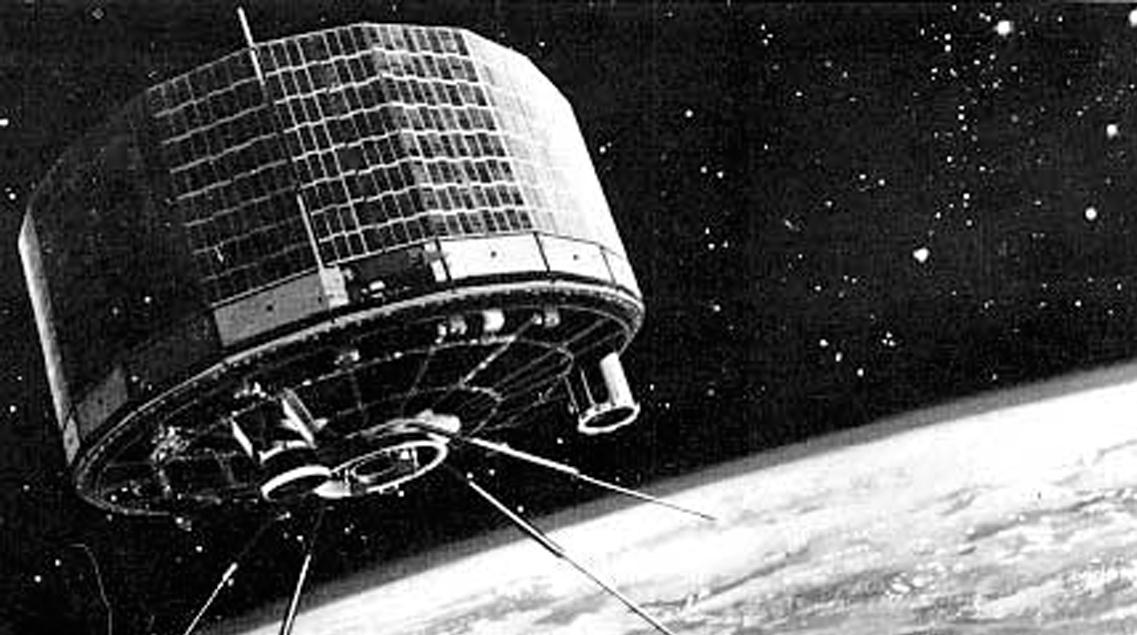
NASA: On April 1, 1960, the National Aeronautics and Space Administration (NASA) launched the Television Infra-Red Observation Satellite (TIROS-1), the world’s first successful weather satellite.

In 1970, the Weather Bureau was renamed the National Weather Service and was placed under the newly created National Oceanic and Atmospheric Administration (NOAA), which remains under the Department of Commerce.

The National Weather Service provides weather, hydrologic, and climate forecasts and warnings for the United States, its territories, adjacent waters, and ocean areas for the protection of life and property and the enhancement of the national economy.
NWS data and products form a national information database and infrastructure, which can be used by other governmental agencies, the private sector, the public, and the global community.
This mission is accomplished by providing warnings and forecasts of hazardous weather including thunderstorms, flooding, hurricanes, tornadoes, winter weather, tsunamis, and climate events. The NWS is the sole United States OFFICIAL voice for issuing warnings during life-threatening weather situations.
EAST TENNESSEE WEATHER
FORECASTING HISTORY

Knoxville Kiosk Locations
The Knoxville, Tennessee, weather service office was opened in 1871 and operated by the U.S. Army Signal Service. The Department of Agriculture’s Weather Bureau Office (WBO) took over in 1891. The WBO was moved several times across the city of Knoxville, Tennessee.
Here are the dates and locations:
| Dates | Locations |
| January 1 – 20, 1871 | Dr. Ludlow’s house |
| January 21, 1871 – August 25, 1877 | East College, East Tennessee University |
| August 26, 1877 – July 15, 1897 | U.S. Custom House and Post Office |
| July 16, 1897 – June 18, 1907 | Old College, University of Tennessee |
| June 18, 1907 – May 18, 1917 | Van Deventer Building, 311-313 Wall Avenue |
| May 18, 1917 – Sept 19, 1932 | Brownlow (Henson) Building, 311 Market Street |
| Sept 19, 1932 – March 13, 1934 | New Sprankle Building, 508 West Union Avenue |
| March 13, 1934 – Feb. 28, 1942 | U.S. Post Office & Court House, Corner of Main & Walnut Streets |
| March 1, 1942 – Nov. 11, 1981 | 2nd Floor Adm. Bldg., Knoxville Municipal (McGhee Tyson) Airport |
| Nov. 11, 1981 – March 18, 1997 (closure) | Weather Service Office, back side of the Knoxville Municipal airport on Airbase Road |
 Administration Building of McGhee Tyson Airport, Knoxville, circa 1940. The Cotton Region Shelter instrument for temperature and humidity instruments are located on the top right of the building.
Tennessee Valley River
The Tennessee Valley River Forecast Center was established around 1950 but was downgraded to a Water Supply Forecast Unit in 1957 and closed in 1959. The Knoxville Weather Service Office was closed in 1997, with its functions transferred to the new NWS office in Morristown, Tennessee.
Bristol, Tennessee, Weather Service Office
The Bristol Weather Bureau Airways Station (WBAS) Weather Service Office (WSO) was opened in 1944 at the Tri-Cities Regional Airport. The U.S. Weather Bureau took over operations at the weather station on St. Patrick’s Day 1944. The office was closed on the midnight shift of September 1953 but then later reopened to full-time operations in November 1959. A Weather Service Radar (WSR)-57 network radar was commissioned on May 25, 1972. The Weather Service Office was closed and operations transferred to the Weather Service Forecast Office at Morristown, Tennessee, in 1995.
Chattanooga, Tennessee, Weather Service Office
The Chattanooga, Tennessee, weather service office was opened at the Hamilton County Courthouse in 1879 and operated by the U.S. Army Signal Service. The Department of Agriculture’s Weather Bureau Office (WBO) took over operations in 1893 and moved to the U.S. Customs House. The office relocated to the James Building in downtown Chattanooga in 1909, then the post office in 1934. In July 1940, the main office was relocated to Lovell Field, Chattanooga Airport. At the time, a separate office at the post office processed observational forms from around the country and remained open through at least 1956. A Weather Service Radar (WSR)-74C radar was installed at the airport in the 1980’s, and decommissioned in 1998. The office was closed in 1998, and observations were transferred to a federal contract.
Biographical story of Mr. William F. Reed, Jr., WBO, Chattanooga, TN.
Oak Ridge, Tennessee, Weather Bureau Research Station (USWB) Office
The Oak Ridge Weather Bureau Research Station (USWB) Office was opened in 1948 to support the work of the U.S. Atomic Energy Commission.
In the mid 1960’s, operations were transferred to the new Atmospheric Turbulence and Diffusion Laboratory, which later became part of NOAA’s Air Resources Laboratory.
If you’d like to know more about ATDD’s early research read Ruth Green’s document titled History, Atmospheric Turbulence and Diffusion Division, 1948 – 1992.
Monteagle, Tennessee, Weather Bureau Office
The Monteagle Weather Bureau Office was open from 1942 to 1946. The main purpose of the office was to support Air Commerce for the Federal Aviation Administration (FAA).
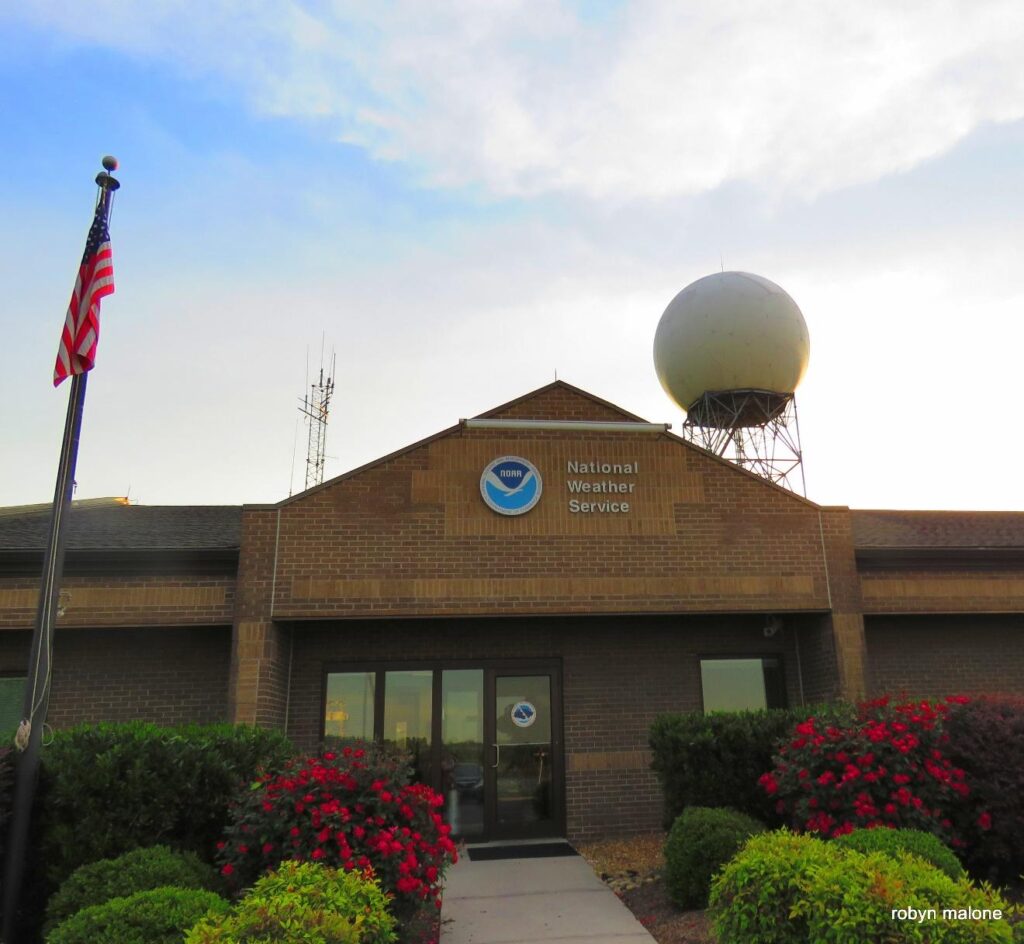
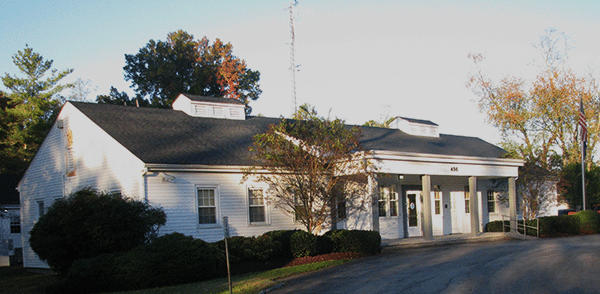
NOAA National Weather Service Forecast Office at Morristown, Tennessee. Courtesy of Robyn Malone.
Morristown, Tennessee NOAA Weather Forecast Office
The Morristown Weather Forecast Office (WFO) was opened in 1994 with the Weather Service Radar (WSR)-88D installed and accepted in late August 1994. The office began operations in 1995 and took warning responsibilities for the Tri-Cities, Knoxville, and Chattanooga areas. The Morristown office was dedicated on August 11, 1995.
The forecast responsibilities were transferred from the Weather Service Forecast Office in Memphis, Tennessee, to Morristown in 1999. The Morristown, Tennessee, WFO is responsible for issuing forecasts, watches, and warnings for East Tennessee, parts of southwest Virginia, and parts of southwest North Carolina.
Click for more information about Morristown, Tennessee WFO
NOTABLE WEATHER EVENTS
ACROSS EAST TENNESSEE

Flood waters at the Tennessee River (formerly Holston River) at the old Gas Plant in 1867. Copy of 1867 photograph. Shows flooded buildings, men sitting on the fence. “Label under photograph: “Great Flood March 8, 1867.” C.M. McClung Historical Collection, Knox County Public Library.
Great Flood of 1867 (Great Freshet)
One of the most significant flood events ever recorded in East Tennessee is the Flood of 1867. Due to the mountainous terrain and valleys across East Tennessee, the Upper Tennessee Valley is especially susceptible to flooding. The Tennessee River flows down the Tennessee Valley with nearly all of the precipitation runoff flowing through the Chattanooga, Tennessee, area.
The Tennessee Valley has been susceptible to significant flooding in the past, especially prior to the Tennessee Valley Authority (TVA) construction of a series of dams. The Flood of 1867 was historic and impacted countless lives along the rivers and streams of East Tennessee, but hitting the Chattanooga area especially hard.
In 1867 the Tennessee River at Chattanooga was usually about 643 feet above sea level at the measuring gauge beneath the Walnut Street Bridge. Flood level was 30 feet above that, or about 673 feet. Much of the land in the Chattanooga area is only 660 to 670 feet above sea level, with only a few areas of higher ground on Cameron Hill, Orchard Knob, McCallie Avenue, and in what is now the museum district of downtown.
At the peak of the historic flooding of 1867, the Tennessee River crested at 701 feet above sea level, nearly 58 feet above normal. This crest placed much of the Chattanooga area under 25 to 30 feet of water.
The heavy rain that resulted in the flooding occurred between March 1-7, 1867. Rapid snow melts across the higher elevations of the southern Appalachian Mountains contributed to the runoff. Though, meteorological data was scarce in 1867, the Tennessee Valley Authority reconstructed the precipitation totals across the southern Appalachians.
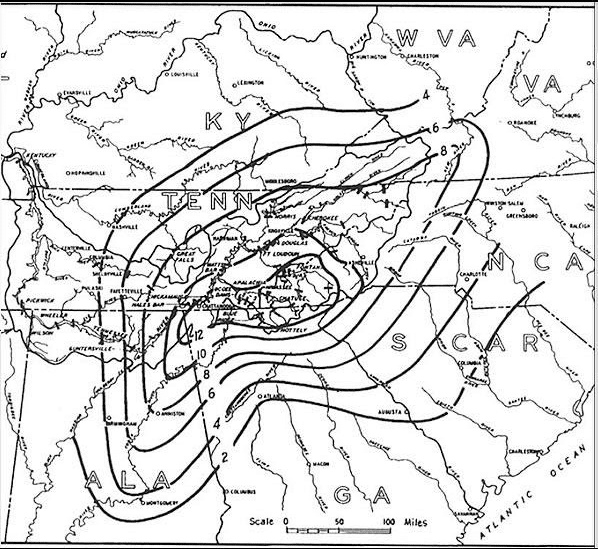
Estimated total rainfall, March 1-7, 1867. Taken from “Flood and Flood Control,” Tennessee Valley Authority (TVA), Technical Report No. 26, 1961, pg. 30.
Click for more information about the 1867 Chattanooga Flood
Another major flood occurred across East Tennessee from April 30 through May 4, 2003. Click for information about this flood event
April 3-4th, 1974 Tornado Outbreak
The Tornado Outbreak of April 3-4, 1974, was one of the biggest and deadliest tornado outbreaks across the nation and Tennessee. From the afternoon of April 3 until the early morning hours of April 4, a total of 148 tornadoes were reported across the Midwest to the Ohio and Tennessee valleys with more than 330 people killed. In East Tennessee, a total of 16 tornadoes were reported. Some of the more devastating tornadoes occurred in Etowah, Maryville, and Newport, Tennessee. A strong tornado occurred in Knox County, killing two people.
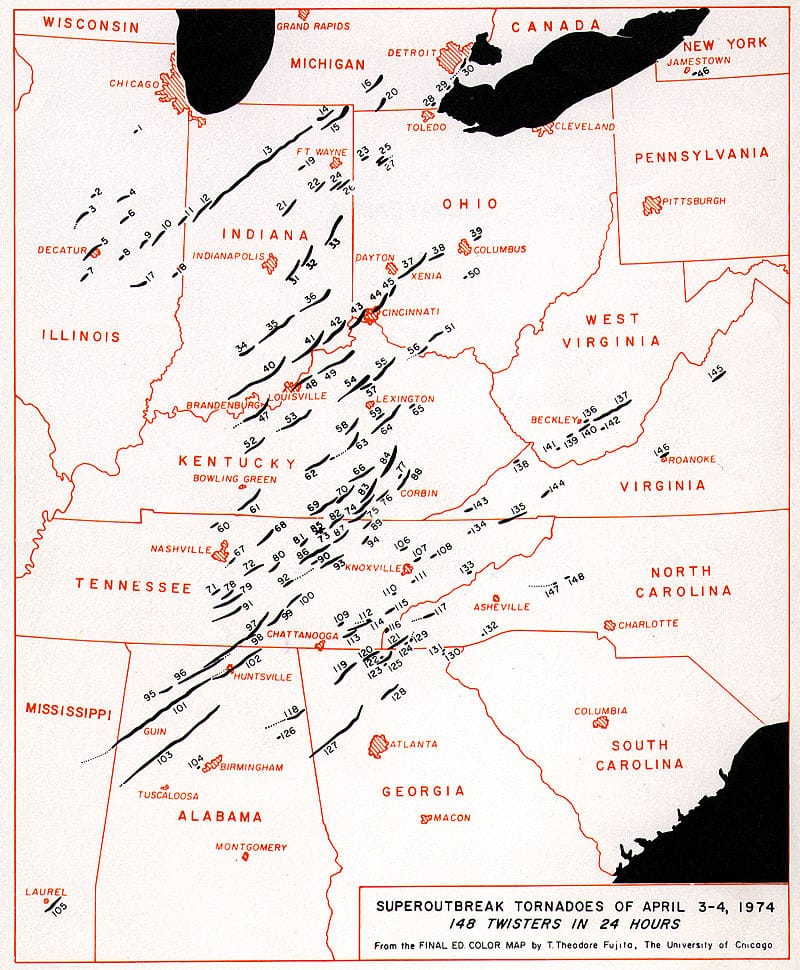
Tracks of tornadoes generated during the 1974 Super Outbreak (Wikipedia)
Click for more information about the 1974 Super Outbreak
Revisiting the 3-4 April 1974 Super Outbreak of Tornadoes
The 1993 Storm of the Century (Blizzard) of March 12-14, 1993
On March 12-14, 1993, a massive storm system moved northeast from the deep south across the southern Appalachians to the northeast United States. The storm system brought blizzard conditions across much of Appalachians, including East Tennessee. The strength of the storm system spanned tornadoes in the deep south, coastal flooding, crippling snow, blizzard conditions, and bone-chilling temperatures in its wake. The total cost of the storm damage was $5.5 billion, or $9.8 billion in today’s currency.
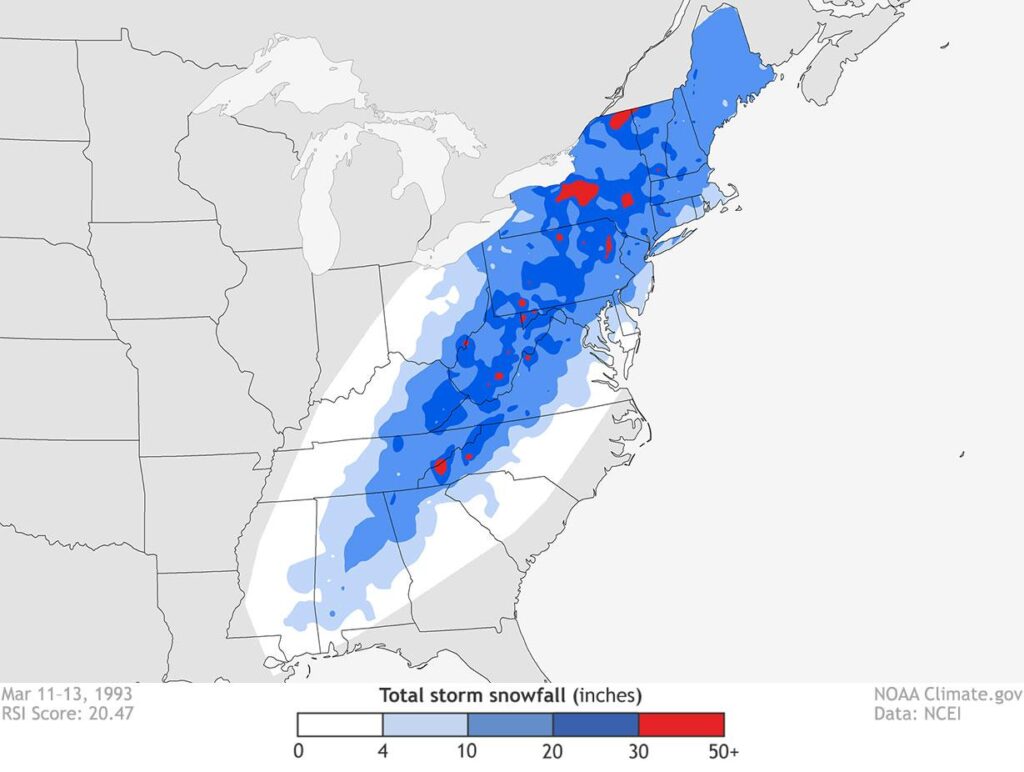
Total storm snowfall from March 11-13, 1993. Courtesy of the National Centers for Environmental Information (NCEI).
For East Tennessee, most locations in the valley received between 1 to 1.5 feet of snow, with the Knoxville airport officially recording 15 inches. The mountains of East Tennessee received much more snowfall, with Mount LeConte buried under 60 inches of snow. High winds associated with the storm produced high drifts across the area making travel hazardous and impossible.
Bradley County, Tennessee, on March 13, 1993
The storm stranded hikers in the Smoky Mountains, knocked out power to thousands for days, and stranding people in their homes. Law enforcement and emergency crews worked long hours to help people in need. Even the National Guard was called upon to use helicopters to drop food and supplies to those who were stuck.

Photo from NOAA, NWS, Tim Armstrong
Click for more information about the 1993 Storm of the Century.
Super Tornado Outbreak of April 27, 2011
On April 27, 2011, a historic outbreak of tornadoes occurred across the southeast United States, including East Tennessee and southwest Virginia. A total of 316 fatalities occurred that day with 32 in Tennessee. Nationwide, 199 tornadoes developed across 14 states. Across east Tennessee, nearly 50 tornadoes were reported with 13 rated as “strong”. The deadliest tornadoes occurred in Collegedale, Tennessee, with 13 fatalities and Camp Creek, Tennessee, with 6 fatalities.
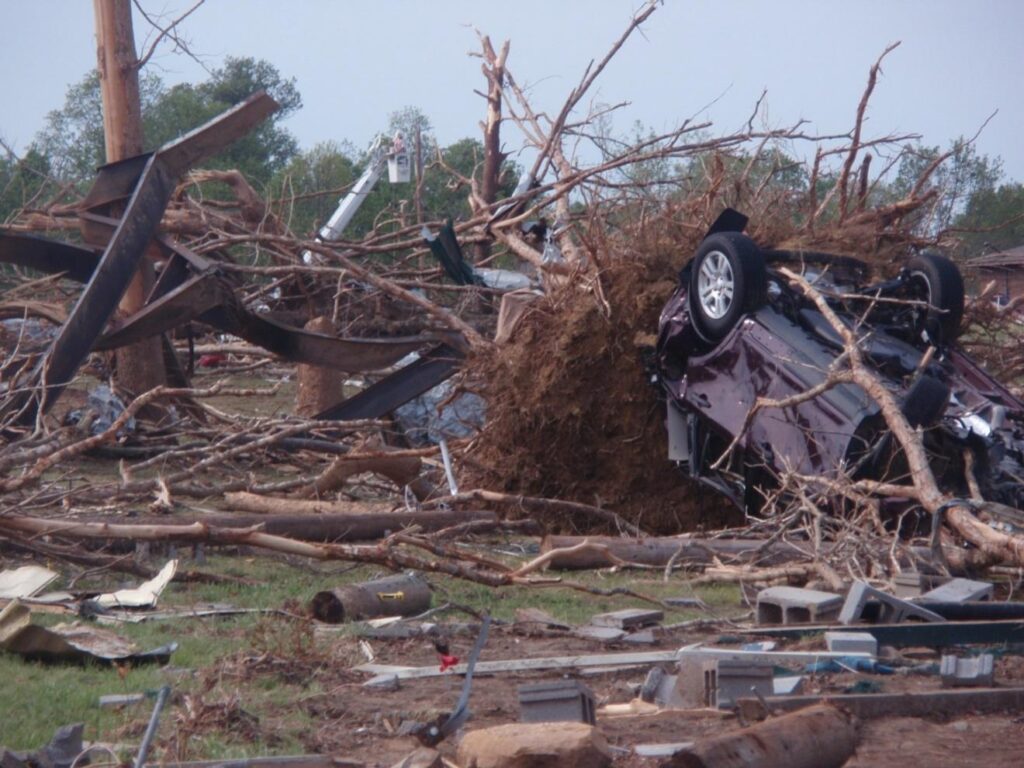
Home and vehicle destroyed in southern Hamilton County during the tornado outbreak of April 27, 2011.
There was a narrow miss in Blount County when an Enhanced Fujita (EF) 4 tornado struck an isolated area of the Great Smoky Mountain National Park. The path of the tornado, which was around 15 miles long and a quarter mile wide and it uprooted trees and snapped large power lines near the Chilhowee Dam. Additionally, people reported up to baseball sized hail with these storms.
An EF3 tornado caused significant damage and eight people lost their lives in Greene County on April 27, 2011. Dedicated on the one-year anniversary of the storms, a memorial stands in Greene County to those killed in two quiet, rural communities.
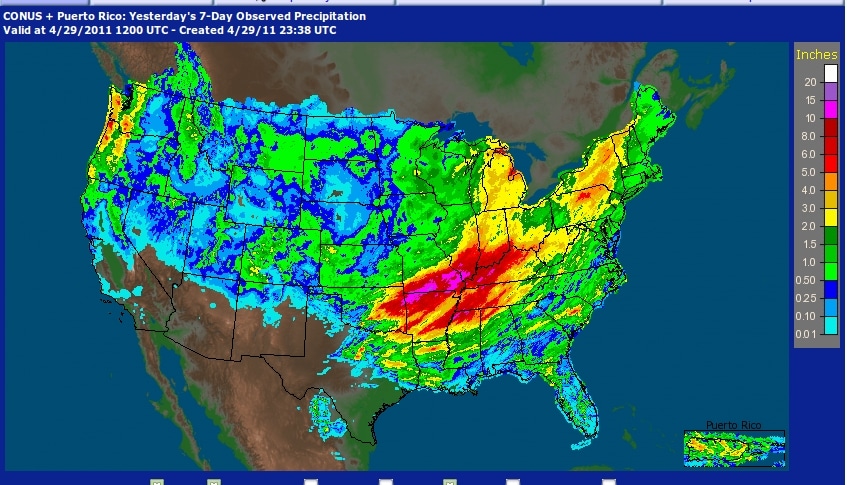
Rainfall totals within the United States for the week ending during the morning of April 29, 2011, which shows the extent of the heavy rain event this cyclone contributed towards. (Wikipedia)
Click for more information about the Super Tornado Outbreak of April 27, 2011
