
EARLY MODERN WEATHER FORECASTING
AND PREDICTING
Some of the questions that meteorologists often receive when giving presentations , are “How do you predict the weather?”, “How do you know when the weather will change?”, or “On what tools do weathermen use to predict the weather?”
Meteorologists use a variety of tools to predict the weather and warn the public of impending hazardous weather. Most people are familiar with the following instruments: thermometers, barometers, and anemometers for measuring temperature, air pressure, and wind speed, respectively. Meteorologists use other tools, as well. Various resources utilized by present day forecasters to predict the weather and the on-going innovation in the science of meteorology and technology can be broken down into sub-groups: supercomputers, models of the atmosphere, National Oceanic Atmospheric Administration (NOAA) observation systems, radar, and satellites.
Supercomputers
The NOAA National Weather Service (NWS) utilize highly advanced supercomputers for forecasting predictions, to issue watches and warnings, to monitor surface and river observations, and to issue many other services to the public.
These computers run sophisticated numerical models of the atmosphere, oceans, rivers, and even space, which are then utilized by NWS forecasters, private sector meteorologists, universities, and the public to help create forecasts, support research, and inform the public of impending hazards.
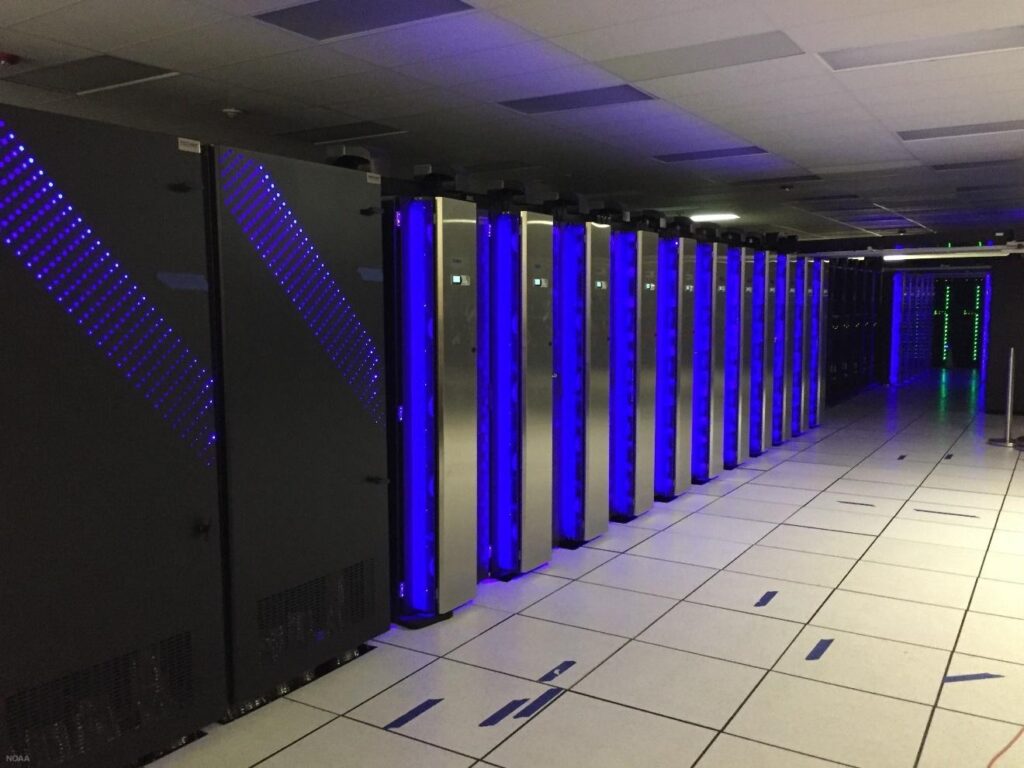
Dell is the latest addition to NOAA’s weather and climate operational supercomputing system. This powerful Dell sits alongside NOAA’s IBM and Cray computers at a data center in Orlando, Florida. The three systems, combined in Florida and Virginia, give NOAA 8.4 petaflops of total processing speed and pave the way for improved weather models and forecasts. (Courtesy of NOAA)
In addition to helping the NWS forecast the weather, the computers’ data is also made available worldwide, which can also help other countries predict their weather.
Surface computer model forecast of dewpoint temperatures across north America for Thursday, July 13, 2017. (Courtesy of NOAA)
“NOAA’s supercomputers ingest and analyze billions of data points taken from satellites, weather balloons, airplanes, buoys and ground observing stations around the world each day. Having more computing speed and capacity positions us to collect and process even more data from our newest satellites to meet the growing information and decision-support needs of our emergency management partners, the weather industry and the public.”
Computer modeling of the atmosphere is the back-bone of weather forecasting for the NWS. The history of using complex mathematical formulas and models to aid in the forecast process can be traced back to the early 20th century. For more information about NWS supercomputers, please visit the NCEP Central Operations website.
Models of the Atmosphere
Instead of looking at current observations and translating these conditions downstream to other cities and communities, the weather community has created numerical modeling of the atmosphere or Numerical Weather Prediction (NWP) models. Numerical weather prediction (NWP) is a method of weather forecasting that employs a set of equations that describe the flow of fluids. These equations are translated into computer code and use governing equations, numerical methods, parameterizations of other physical processes and combined with initial and boundary conditions before being run over a domain (geographic area).
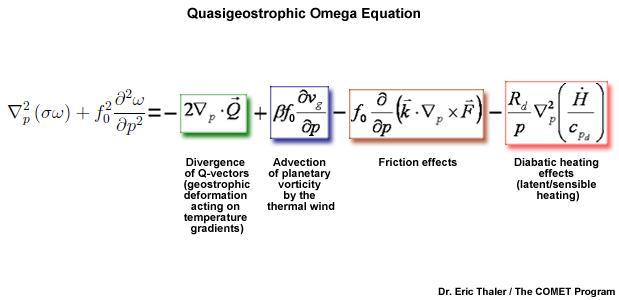
Weather modeling of the atmosphere utilizes complex numerical calculations. This particular equation is used to solve for the vertical motion of the atmosphere.
Computer modeling of the atmosphere is the back-bone of weather forecasting for the NWS. The history of using complex mathematical formulas and models to aid in the forecast process can be traced back to the early 20th century.
Despite the continued improvement in meteorology and computer resources, don’t expect a perfect weather forecast anytime soon. NWP modelling is still evolving and the observational network by which these calculations require are not dense enough to capture all of the micro-scale weather. Only a small discrepancy can make a significant difference in the NWP model.
In 1961, meteorologist and chaos theory founder Edward N. Lorenz took a close look at the drastically different models a difference of a single decimal point could make. Based on these findings, Lorenz coined the term butterfly effect, in which the question is asked, “Does the flap of a butterfly’s wings in Brazil set off a tornado in Texas?”
Even though NWP modeling is not perfect, the forecast output has helped forecasters save countless lives. Meteorologists have used this information to predict winter storms, severe weather outbreaks, strength and path of destructive hurricanes, river and stream forecast, etc.
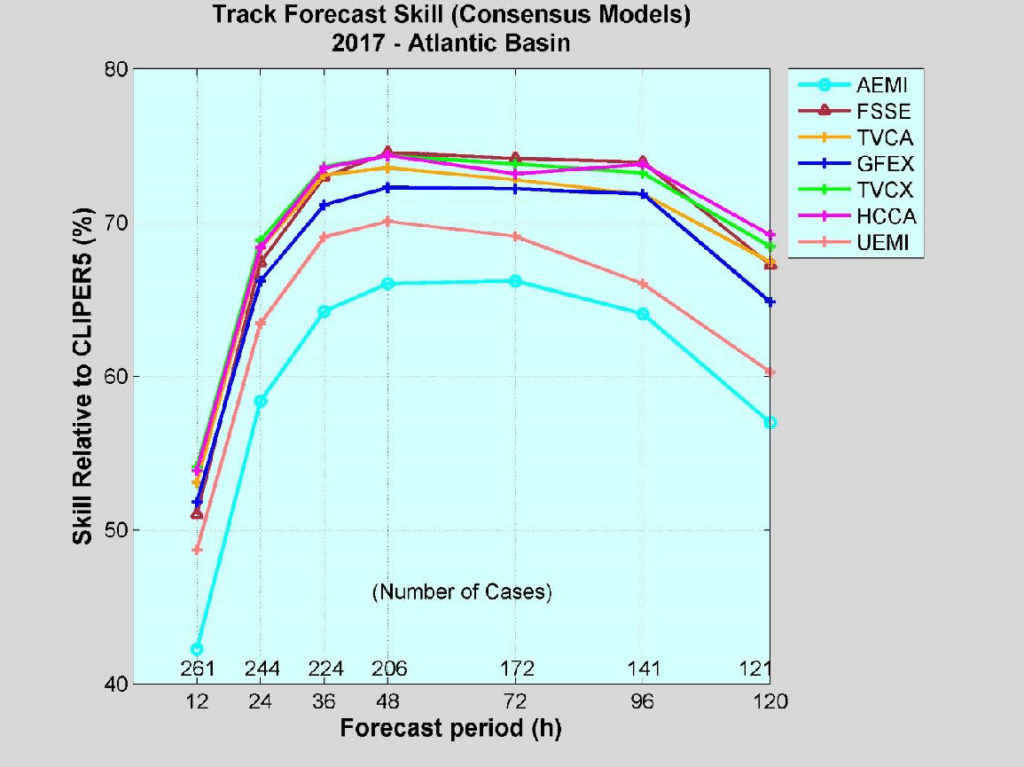
Homogenous comparison of the primary Atlantic basin track consensus models for 2017. (Courtesy of the National Hurricane Center)

Homogenous comparison for selected Atlantic basin early intensity guidance models for 2015-2017. (Courtesy of the National Hurricane Center)
By the end of 1849, 150 volunteers throughout the United States were reporting weather observations to the Smithsonian regularly. By 1860, 500 stations were furnishing daily telegraphic weather reports to the Washington Evening Star, and as the network grew, other existing systems were gradually absorbed, including several state weather services.
Using the observation data, weather maps were drawn and surface wind patterns and storm systems could be identified and studied. Weather-observing stations began appearing all across the nation and globe in the 1860s. The United States government recognized the need to organize and maintain a nationalized weather service, thus the National Weather Service was created.
Upper Air Soundings
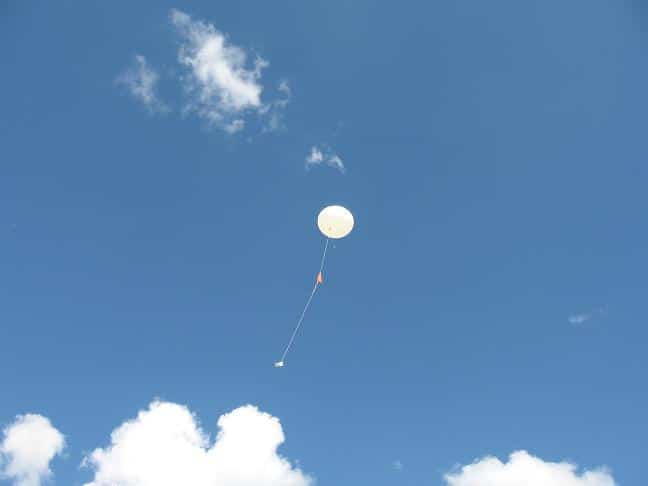
Radiosonde weather balloons are released twice daily from nearly 100 locations in the United States. These special balloons have an instrument pack on them that measures temperature, air pressure, wind speed, and wind direction in all the layers of the troposphere.
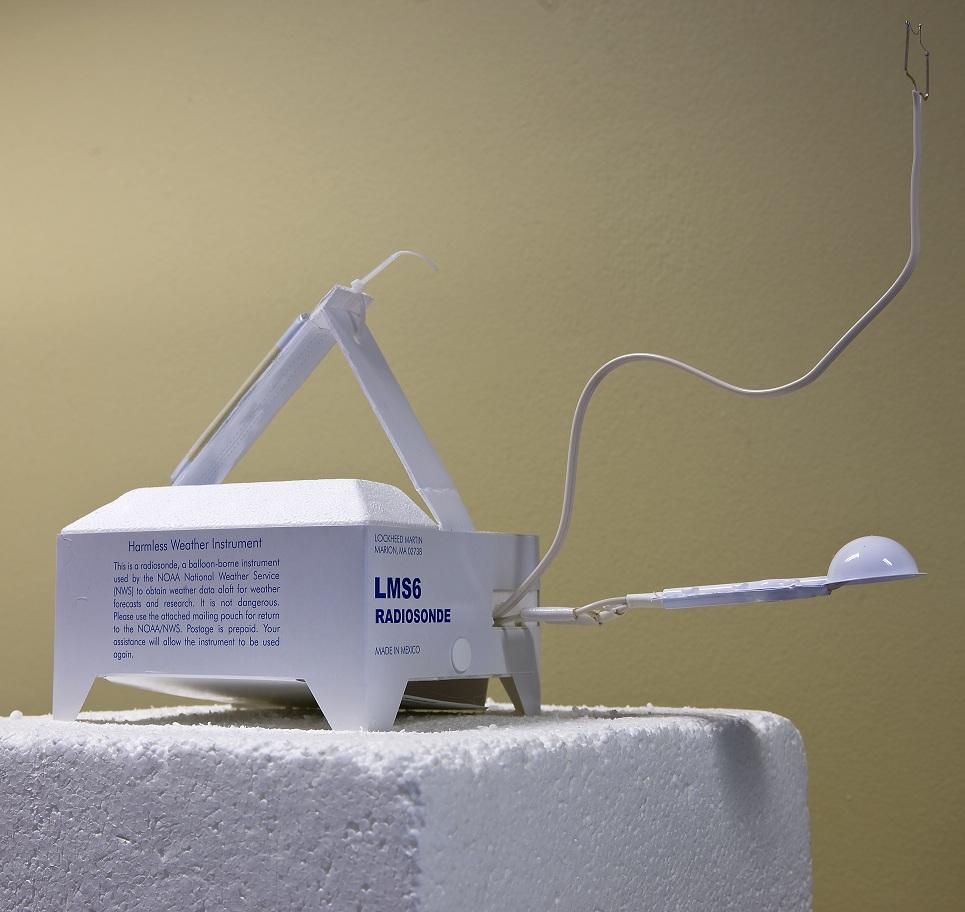
Radiosonde equipment. Courtesy of NWS Nashville, Tennessee.
The data collected by the weather balloons are ingested into computer forecast models where equations are run using the data. The radiosonde data provides valuable information for numerical weather models, aviation safety and to identify the potential for severe weather, winter storms, and hurricane formation.

The radiosonde equipment is lifted by a hydrogen balloon. There is also a parachute below the balloon which allows the instrument to float safely back to earth once the balloon bursts.
The radiosonde consists of a radio transmitter, GPS, temperature sensor (called a thermistor), humidity sensor (called a hygristor), and pressure sensor. The winds aloft are computed from the measured elevations and location of the radiosonde at a given pressure (recall pressure decreases with elevation). The height of the balloon is also calculated. So, from this simple instrument, the complete temperature, moisture, wind and pressure field in the vicinity of the launch station can be obtained during its two-hour journey to nearly 100,000 feet up into the atmosphere.
Automated Surface Observation System (ASOS)
Today’s weather reporting is a mix of the manual reporting of the past and new automated systems. First let’s take a look at some of the automated systems.
In the 1990’s a joint venture between the National Weather Service, FAA, and Department of Defense resulted in the installation of a nationwide network of reporting sites known as Automated Surface Observing System, or ASOS. These systems were developed and implemented to support aviation, but their data is widely used in forecast models and for climatology. They are largely installed at major airports and military installations, but have been installed in other areas with a need for the data.
These sites do more than the instruments of the past…they combine those weather elements with ones that used to be observed by humans.
These additional elements include:
- Sky Cover
- Cloud Heights
- Visibility & Obstructions to Visibility
- Precipitation Type
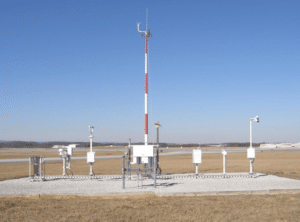
The Automated Surface Observing Systems (ASOS) program is a joint effort of the National Weather Service (NWS), the Federal Aviation Administration (FAA), and the Department of Defense (DOD). The ASOS system serves as the nation’s primary surface weather observing network. ASOS is designed to support weather forecast activities and aviation operations and, at the same time, support the needs of the meteorological, hydrological, and climatological research communities. ASOS works non-stop, updating observations every minute, 24 hours a day, every day of the year.
Getting more information on the atmosphere; more frequently and from more locations is the key to improving forecasts and warnings. ASOS information helps the NWS to increase the accuracy and timeliness of its forecasts and warnings. In addition, a basic strength of ASOS is that critical aviation weather parameters are measured where they are needed most: within airport runway environments.
Radar
The ability to detect precipitation coverage and intensity has enabled NWS meteorologists to examine storms and their intensity with much more precision. The most effective way to detect precipitation is the use of the radar, which stands for RAdio Detection And Ranging.
The radar used by the NWS is called the WSR-88D, which stands for Weather Surveillance Radar (WSR) built in 1988. The “D” stands for Doppler radar, meaning it can detect precipitation particles motion toward or away from the radar as well as the location and intensity of precipitation areas. The ability to see motion greatly improves meteorologist ability to detect rotation of the thunderstorm and the potential of tornado-genesis.
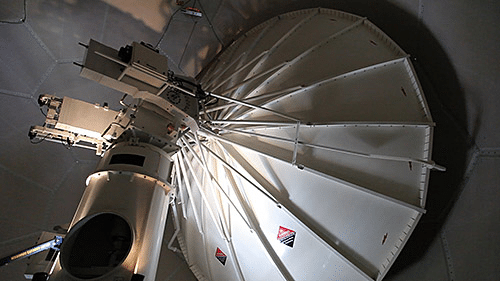
The Weather Surveillance Radar (WSR) – 88D
There are 155 WSR-88D radars across the nation, including the United States Territory of Guam and the Commonwealth of Puerto Rico. These radars are operated and maintained by the NWS and the Department of Defense. (https://radar.weather.gov/)
For more information about the WSR-88D, please go to the following website: https://www.weather.gov/jetstream/doppler_intro
Satellite
Weather satellites are a critical observational tool that the NWS utilizes for forecast and warning operations. Satellite data provides a larger spatial view of the weather complimenting land-based systems such as radiosondes, radars, and surface observing systems.
Weather satellites are either polar orbiting or geostationary. Both types of satellite systems produce very different products. The two polar orbiting satellites in the north-south orbits, observe the same spot on the Earth twice daily, once during the daylight and the other at night-time.
The Polar orbiting satellites provide imagery over the entire Earth. Geostationary satellites are in orbit around 22,000 miles above the equator. They spin at the same rate as the Earth and constantly focus on the same area. This allows the satellite to take pictures of the Earth at the same location every 30 minutes.

East-West orbit of the GOES Satellite

North-South orbit of the Polar Satellite
The satellite data provide imagery over the North and South America and the Atlantic and Pacific oceans. During severe weather outbreaks, the geostationary satellites can provide meteorologists with images every 5 to 15 minutes. One special occasions the frequency of satellite images can increase to every minute with very high resolution.
For more information on NOAA Satellite data, please go to the following website:
https://www.noaa.gov/satellites
To learn how Weather Satellites Imagery and Data products are used in NWS operations, visit: https://noaasis.noaa.gov/NOAASIS/ml/genlsatl.html
NWS COMMUNICATIONS TODAY
The National Weather Service communicates in a variety of ways and utilizes newer and older technologies.
NOAA Weather Radio All Hazards (NWR) is a nationwide network of radio stations broadcasting continuous weather information directly from the nearest National Weather Service office. NWR broadcasts official Weather Service warnings, watches, forecasts and other hazard information 24 hours a day, 7 days a week.
Working with the Federal Communication Commission’s (FCC) Emergency Alert System , NWR is an “All Hazards” radio network, making it your single source for comprehensive weather and emergency information. In conjunction with Federal, State, and Local Emergency Managers and other public officials, NWR also broadcasts warning and post-event information for all types of hazards – including natural (such as earthquakes or avalanches), environmental (such as chemical releases or oil spills), and public safety (such as AMBER alerts or 911 Telephone outages).
Known as the “Voice of NOAA’s National Weather Service,” NWR is provided as a public service by the National Oceanic and Atmospheric Administration (NOAA), part of the Department of Commerce. NWR includes more than 1000 transmitters, covering all 50 states, adjacent coastal waters, Puerto Rico, the U.S. Virgin Islands, and the U.S. Pacific Territories. NWR requires a special radio receiver or scanner.
